Mortgage rates are back above 7%, building costs are rising and fewer new homes are being finished. Here is what 21 months of policy change have meant for prices, rents and yields in the US markets where Bricksave invests.


By Ruben Pueyo | Bricksave
October 29, 2026
News > Blog Article > Higher costs, stronger rents: Trump's second …
Mortgage rates are back above 7%, building costs are rising and fewer new homes are being finished. Here is what 21 months of policy change have meant for prices, rents and yields in the US markets where Bricksave invests.
Twenty-one months into Donald Trump's second term, the biggest change for US rental property has been cost, not demand. Dearer borrowing, dearer materials and fewer new homes have kept more households renting.
This article sets out what the data shows since January 2025, which policies plausibly contributed, and what has little to do with Washington. We focus on the single-family rental markets where Bricksave invests, Chicago, Cleveland and New York, with a shorter look at Detroit, Philadelphia, San Antonio and Miami. If you are new to the model, start with how fractional property investment works.
Borrowing has not become cheaper. The 30-year fixed mortgage rate averaged 7.04% in mid-January 2025 and 7.32% on 22 October 2026. In between, it fell to 6.06% in January 2026, a three-year low (Freddie Mac, October 2026).
The Federal Reserve cut its policy rate three times in late 2025, then raised it in September 2026, its first increase since 2023 (Federal Reserve, September 2026). The trigger was inflation: consumer prices rose 3.7% in the year to September, led by energy (BLS, October 2026). Mortgage rates follow the 10-year Treasury yield, now around 5%, more closely than the Fed's own rate.
High rates hurt buyers, but they keep tenants renting.
For rental owners, the effect cuts both ways. High rates limit price growth and make leverage expensive. High rates hurt buyers, but they keep tenants renting. Demand for single-family rentals rose 21.6% year on year in September (Zillow via Mortgage.news, October 2026).
Tariffs on lumber, steel, aluminium and other materials have raised the cost of building and renovating. Labour is the second pressure. Immigrants make up more than a quarter of the construction workforce, and the National Association of Home Builders (NAHB) estimates a shortage of about 300,000 workers, made worse by stepped-up immigration enforcement (NAHB, September 2026).

The result is less new supply. Housing completions fell 14.0% in the year to September 2026 (US Census data via Mortgage News Daily, October 2026). Builder confidence fell to 29, its lowest since June 2012, with builders citing higher costs for loans, materials and diesel (NAHB, October 2026).
Not all of this comes down to policy. The apartment building boom of 2021–2024, which held rents down through 2025, was already fading after the Fed's 2022–2023 rate rises. Fewer completions now mean less competition for existing rental homes.
The flip side for owners is maintenance.
The flip side for owners is maintenance. Appliances, roofing and heating systems cost more to replace while tariffs and labour shortages last.
Nationally, home prices rose just 1.9% in the year to July 2026. That headline hides a wide split. Chicago (+6.9%), New York (+5.8%) and Cleveland (+4.2%) were the three strongest of the 20 cities in the index (S&P Cotality Case-Shiller, September 2026). Much of the West and Sun Belt has been weaker, a trend that began before 2025.
Rents follow the same pattern (Zillow, October 2026).
| Metro | Home value YoY | Rent YoY | Typical rent | Gross yield |
|---|---|---|---|---|
| Chicago | +5.1% | +4.7% | $2,163 | 7.2% |
| Cleveland | +3.8% | +4.5% | $1,440 | 6.9% |
| New York | +4.8% | +4.2% | $3,546 | 5.8% |
| Detroit | +1.5% | +4.2% | $1,514 | 6.9% |
| Philadelphia | +2.4% | +3.3% | $1,903 | 5.9% |
| Miami | +0.9% | +1.8% | $2,654 | 6.7% |
| San Antonio | −1.9% | −0.7% | $1,415 | 6.2% |
| United States | +1.0% | +2.7% | $1,932 | 6.3% |
Source: Zillow, September 2026 data. Gross yield is a Bricksave calculation: a year's typical rent divided by typical home value, before costs.
Chicago combines the strongest price growth with the highest gross yield of the three core markets. Cleveland has the lowest entry prices, but homes for sale there rose 16.6%, which could slow price growth next year. San Antonio is still absorbing a wave of new supply, with values and rents both falling.
The One Big Beautiful Bill Act, signed on 4 July 2025, made 100% bonus depreciation permanent and left 1031 like-kind exchanges unchanged (CLA, July 2025). A proposed "retaliatory" tax on investors from certain countries, known as Section 899, was dropped from the final law. FIRPTA, the withholding regime for foreign sellers, is unchanged.

A separate law, the 21st Century ROAD to Housing Act, bars investors controlling 350 or more homes from buying single-family homes, including duplexes (Morgan Lewis, July 2026). The ban takes effect on 7 January 2027, and the Treasury published its proposed rule on 22 October (The Spokesman-Review, October 2026). It is aimed at the largest institutional buyers, and its final shape depends on that rule.
If you earn in reais or pesos, the dollar matters as much as the property. The Brazilian real averaged 5.14 per dollar in September 2026, against 5.36 a year earlier. The Mexican peso averaged 17.27, against 18.48 (Federal Reserve, October 2026). A stronger local currency reduces the value of USD rent and gains when you convert them home. It also makes US property cheaper to buy today.
Foreign buyers bought $45.3 billion of US homes in the year to March 2026, down 19.1%, with Mexico one of the two largest sources by number of homes (NAR, July 2026).
Looking ahead, Fannie Mae expects mortgage rates of about 7.5% through 2027 and national home price growth of 0.6% that year (Fannie Mae via Florida Realtors, October 2026). That points to slow price growth nationally, steady rental demand and costs that need watching. Forecasts change: Fannie Mae raised its 2027 rate forecast by 0.8 percentage points in a single month.
Targets are not results. The average annual return across Bricksave's US portfolio was 7.65% in Q3 2026 (Bricksave property financials, October 2026). Compare any return in both USD and your own currency.
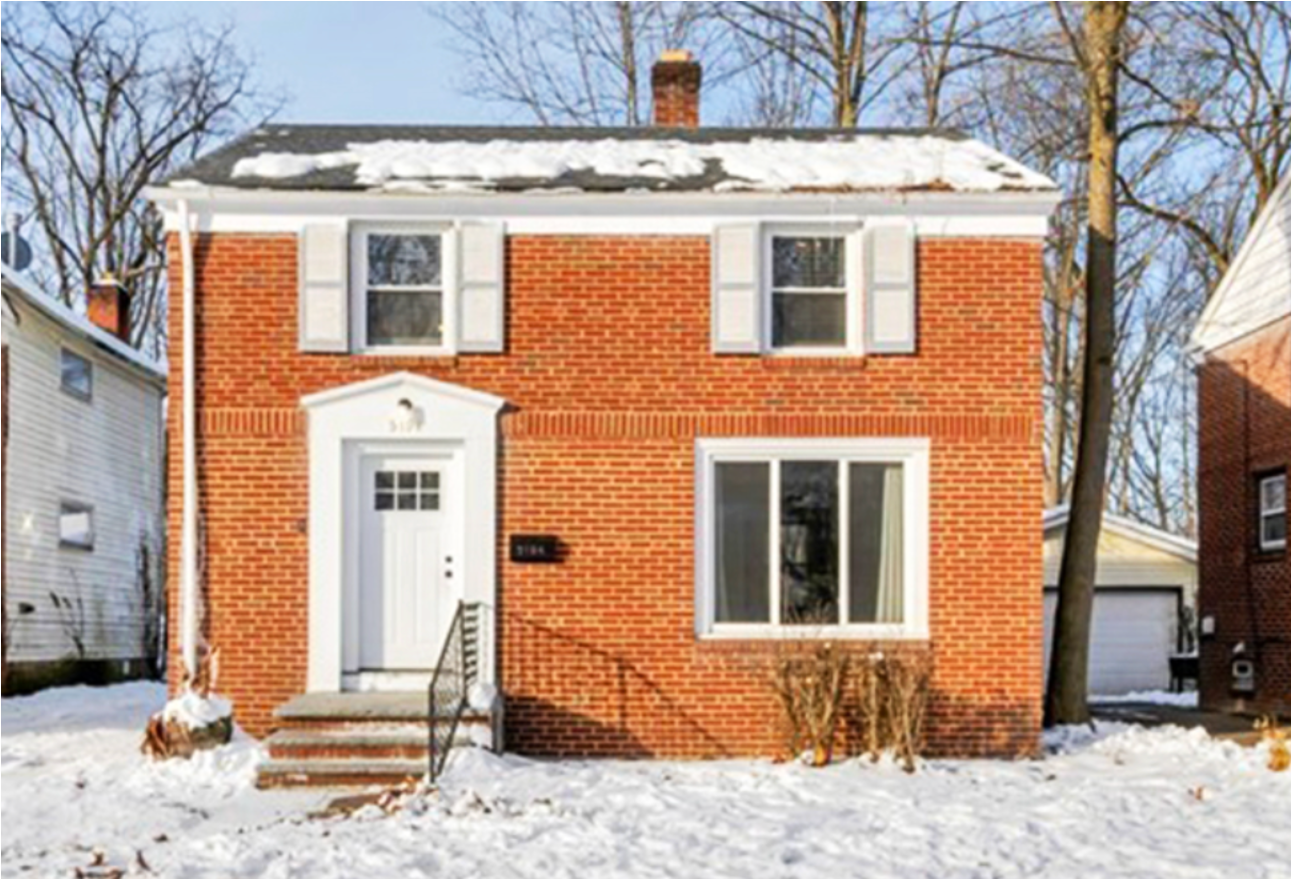
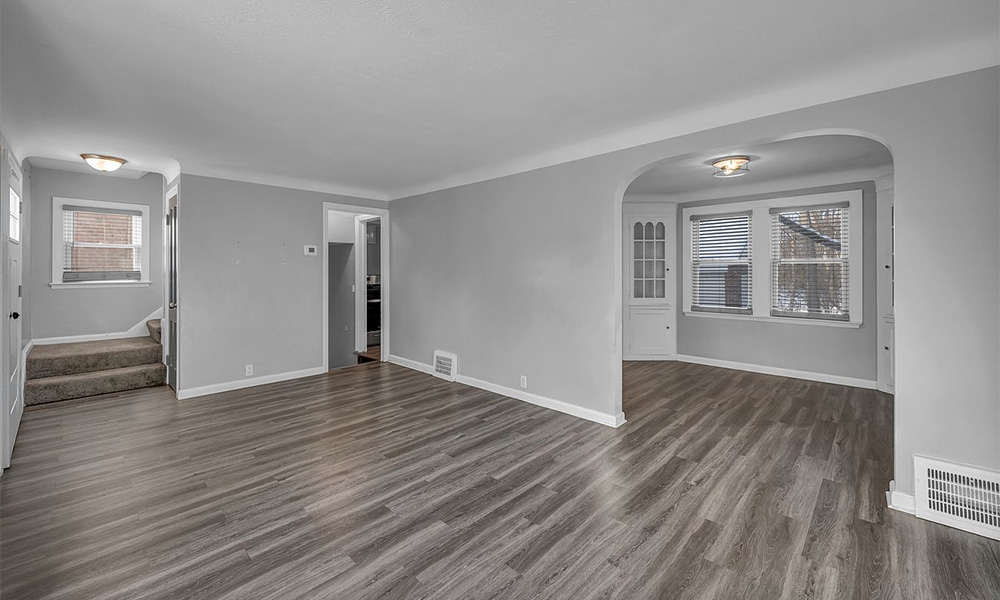
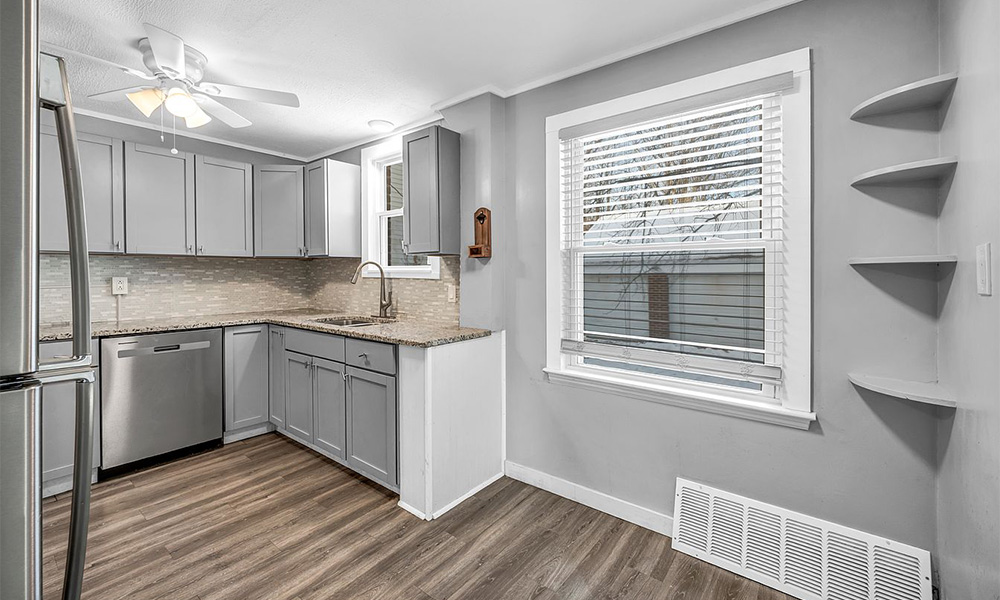
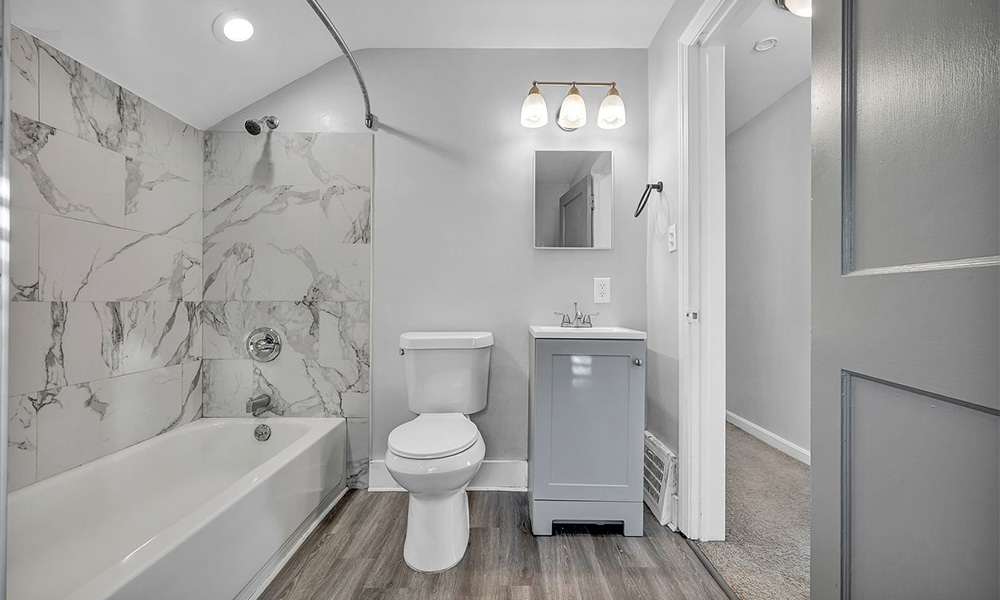
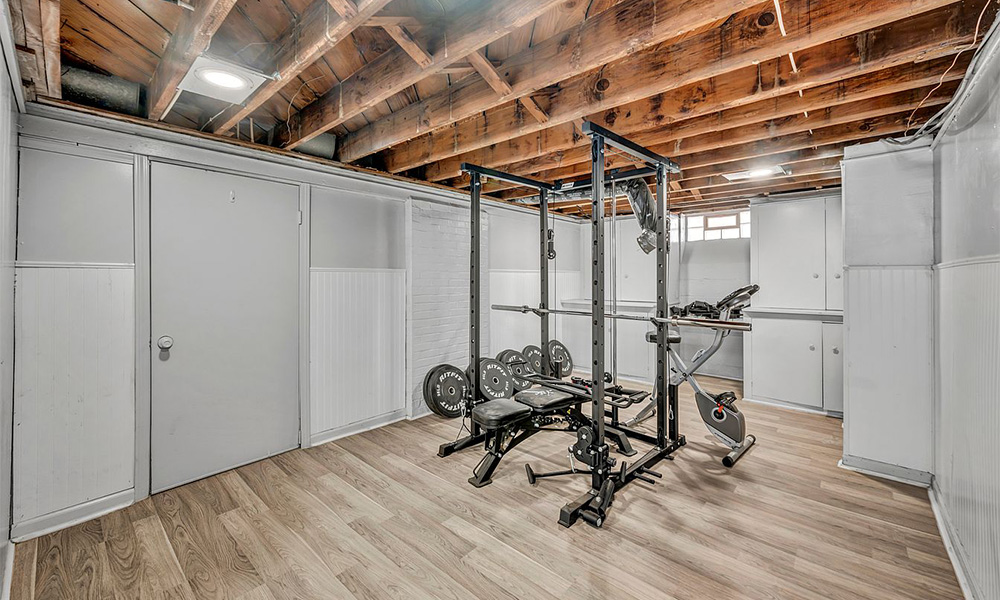
Refurbished single-family home · rental + refurbishment strategy · 4-year hold
*Forecasts are estimates and are not a reliable indicator of performance. Targeted returns are subject to the performance of each individual property. Projections, not guarantees. Capital is at risk.
Fractional investments are held for a fixed term; private resale via the platform may be possible but is not guaranteed. Rental income depends on occupancy, and appreciation depends on market conditions at exit, including interest rates and policy decisions that can change at short notice. Returns converted into your own currency also depend on exchange rates. Targeted returns reflect the performance of each individual property, and the average annual return across Bricksave's US portfolio was 7.65% in Q3 2026. Capital is at risk.
Click here for detailed information about the risks of real estate investment
Investing carries risks, including loss of capital and illiquidity. Please read our Risk Warning before investing.